-
Posted on: 01 Jul 2025
-
Understanding student loan debt statistics for 2025 is crucial for borrowers, policymakers, and educational institutions. This comprehensive guide delves into the latest figures, exploring average debt loads, total outstanding balances, and the evolving landscape of student financing.
Understanding Student Loan Debt in 2025
The landscape of higher education financing continues to be a significant economic and social issue. As we move through 2025, the sheer volume of student loan debt outstanding and the average burden carried by graduates remain critical points of discussion. This section aims to provide a foundational understanding of what constitutes student loan debt and why these statistics are so vital for individuals and the broader economy.
Student loan debt refers to the money borrowed by students to finance their post-secondary education. This can include tuition, fees, room and board, books, and other educational expenses. These loans can come from federal sources, such as the U.S. Department of Education, or private lenders like banks and credit unions. The accumulation of this debt has a profound impact on the financial well-being of millions, influencing major life decisions like purchasing a home, starting a family, or pursuing further education.
In 2025, understanding the current student loan debt statistics is not just about numbers; it's about recognizing the challenges faced by a generation and the economic implications of this debt. It influences consumer spending, retirement savings, and overall economic growth. For students and their families, these statistics serve as a crucial benchmark for understanding the financial commitment involved in higher education and for making informed decisions about borrowing and repayment strategies. This guide will break down the most pertinent data points, offering clarity and actionable insights.
The Colossal Total Student Loan Debt Overview
The sheer magnitude of student loan debt in the United States is staggering. By early 2025, the total outstanding student loan debt has reached unprecedented levels, impacting millions of Americans and the national economy. This section will provide a comprehensive overview of this total debt figure, its historical context, and its significance.
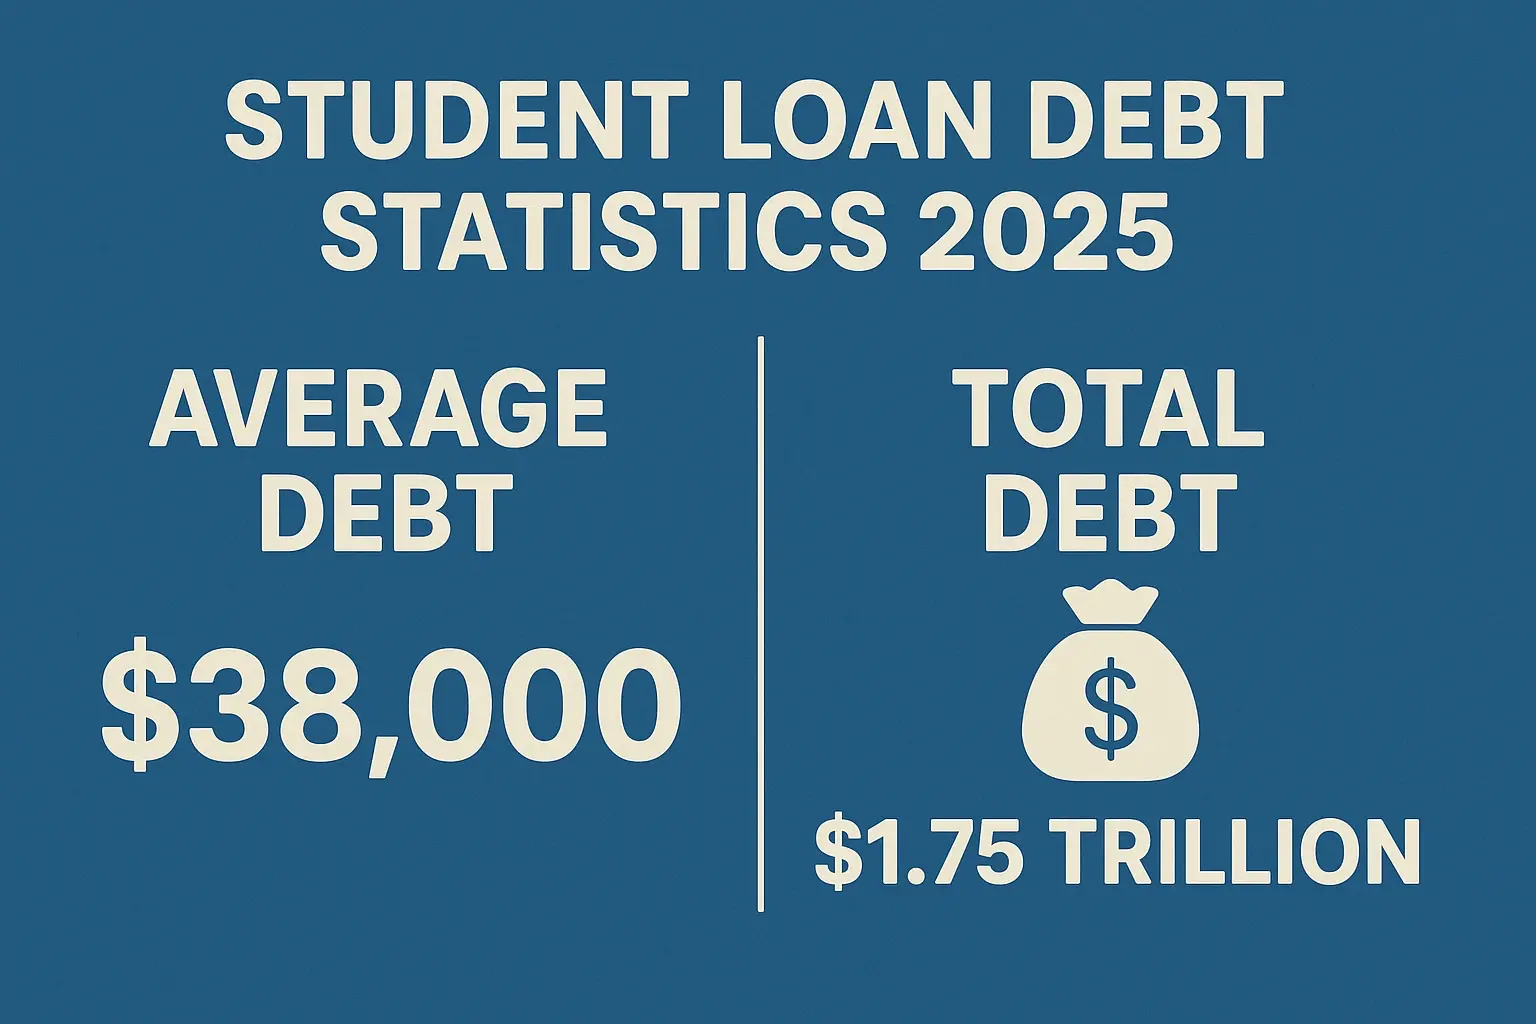
As of the most recent available data for 2025, the total student loan debt in the U.S. hovers around an astonishing $1.77 trillion. This figure represents the aggregate amount owed by millions of borrowers across federal and private student loans. This colossal sum has grown exponentially over the past two decades, driven by rising tuition costs, increased college enrollment, and a greater reliance on borrowing to fund educational pursuits.
To put this into perspective, the total student loan debt is a significant portion of the national debt and a major consumer debt category, surpassing auto loans and credit card debt. This immense financial obligation has far-reaching consequences:
Economic Drag: The burden of debt can stifle economic growth by reducing discretionary spending, delaying major purchases like homes and cars, and hindering small business formation.
Generational Impact: Millennials and Gen Z are particularly affected, with a significant portion of their income dedicated to loan repayment, impacting their ability to build wealth and achieve financial milestones.
Policy Focus: The sheer size of this debt has made it a central issue in political discourse, leading to discussions and debates around student loan forgiveness, interest rate reform, and tuition affordability.
The trajectory of total student loan debt has been on an upward trend for years. While there have been some fluctuations due to economic conditions and policy interventions, the overall picture in 2025 is one of continued high levels of indebtedness. Understanding this aggregate number is the first step in grasping the scope of the student loan crisis and its implications for individuals and the nation.
Historical Growth of Student Loan Debt
The growth of student loan debt has not been a sudden phenomenon. It's a trend that has been building for decades. In the early 2000s, total student loan debt was significantly lower, often cited in the hundreds of billions. By 2010, it had surpassed $800 billion and continued its rapid ascent. The financial crisis of 2008, coupled with steadily increasing tuition costs, accelerated this growth. Federal policy shifts, such as the consolidation of federal loan programs and increased availability of federal loans, also contributed to the rise, making higher education more accessible but also leading to higher borrowing amounts.
By 2025, the cumulative effect of these factors has resulted in the trillion-dollar-plus debt burden we see today. This historical perspective is crucial for understanding the current situation and for projecting future trends. It highlights the systemic issues that have led to this point, including the rising cost of education outpacing inflation and wage growth.
Federal vs. Private Debt Composition
Within the $1.77 trillion total, the vast majority, approximately 92%, is held in federal student loans. This leaves roughly 8% in private student loans. Federal loans are generally considered more borrower-friendly, offering income-driven repayment plans, deferment and forbearance options, and potential for loan forgiveness programs. Private loans, on the other hand, often come with less flexible terms and fewer consumer protections. The dominance of federal debt in the total figure underscores the government's significant role in financing higher education.
Average Student Loan Debt: A Deep Dive by Degree
While the total student loan debt paints a broad picture, understanding the average debt load per borrower provides a more granular view of the financial burden individuals face. This average can vary significantly depending on the type of degree pursued, the institution attended, and the borrower's major. In 2025, these averages continue to be a critical metric for prospective students and their families.
The average student loan debt for a bachelor's degree graduate in 2025 is estimated to be around $30,000 to $40,000. However, this figure is a simplification, as the actual amount can be much higher or lower. It's essential to look at the nuances within this average.
Undergraduate Debt Averages
For students completing a four-year bachelor's degree, the average debt has been steadily climbing. While some may graduate with little to no debt, many are faced with substantial loan balances. Factors influencing this average include:
Tuition and Fees: The cost of attendance at public versus private institutions, in-state versus out-of-state tuition, and the specific program of study all play a role.
Living Expenses: Room, board, books, and personal expenses can add significantly to the total amount borrowed.
Financial Aid Packages: The amount of grants, scholarships, and work-study offered by an institution can reduce the need for loans.
It's important to note that the "average" can be skewed by a smaller number of borrowers with extremely high debt loads. Many graduates may fall below this average, while others significantly exceed it.
Graduate and Professional Degree Debt
The financial commitment escalates dramatically for those pursuing advanced degrees. Students in graduate programs, especially professional fields like law, medicine, and business, often borrow much larger sums. By 2025:
Master's Degrees: The average debt for a master's degree can range from $40,000 to $60,000, depending on the field.
Doctoral Degrees (Ph.D.): While many Ph.D. programs offer stipends and tuition waivers, some students still incur significant debt, particularly in fields that require extensive coursework or research without full funding.
Professional Degrees (Law, Medicine, Dentistry): Graduates from these programs often face the highest debt burdens. A law degree can lead to an average debt of $100,000 to $200,000 or more, while medical school graduates can accrue $200,000 to $300,000 or even higher in student loan debt.
These higher figures for graduate and professional degrees reflect the longer duration of study and the often higher cost of specialized programs. This substantial debt can significantly impact career choices, potentially steering graduates towards higher-paying fields to manage repayment, even if their passion lies elsewhere.
Debt by Major and Institution Type
The choice of major and the type of institution also influence average debt levels. STEM fields, while often leading to higher earning potential, can still involve significant borrowing. Humanities and arts degrees, which may have lower average starting salaries, can lead to a longer repayment period for similar debt loads. Similarly, attending a private, non-profit university or a for-profit institution typically results in higher average debt compared to public, in-state universities.
For example, a comparison might show:
Institution Type
Estimated Average Bachelor's Debt (2025)
Public, In-State University
$25,000 - $35,000
Public, Out-of-State University
$35,000 - $45,000
Private, Non-Profit University
$40,000 - $55,000
For-Profit Institution
$50,000 - $70,000+
This table illustrates the financial implications of choosing different educational pathways. The decision of where and what to study has a direct correlation with the amount of student loan debt a graduate will carry.
Federal vs. Private Student Loans: A Statistical Comparison
Understanding the distinction between federal and private student loans is crucial, as they differ significantly in terms, repayment options, and borrower protections. In 2025, the majority of student loan debt is federal, but private loans play a notable role, especially for students who have exhausted federal borrowing limits or attend institutions not eligible for federal aid.
Federal Loan Characteristics
Federal student loans, issued by the U.S. Department of Education, are the backbone of student financing. As of 2025, key characteristics include:
Fixed Interest Rates: Generally lower and fixed for the life of the loan, offering predictability. For new loans disbursed in 2025, rates are set annually.
Income-Driven Repayment (IDR) Plans: These plans cap monthly payments at a percentage of the borrower's discretionary income, providing a safety net.
Deferment and Forbearance: Options to temporarily pause payments during periods of unemployment or economic hardship.
Loan Forgiveness Programs: Such as Public Service Loan Forgiveness (PSLF) for those working in public service careers.
No Credit Check for Most Loans: Eligibility is primarily based on financial need and enrollment status.
The total amount of federal student loan debt is the dominant portion of the $1.77 trillion figure, reflecting their widespread availability and use.
Private Loan Characteristics
Private student loans are offered by banks, credit unions, and other financial institutions. They are credit-based and typically require a co-signer for students with limited credit history. Key features in 2025 include:
Variable or Fixed Interest Rates: Rates can be higher than federal loans and may fluctuate, making budgeting more challenging.
Credit-Based Eligibility: Approval and interest rates depend heavily on the borrower's and co-signer's creditworthiness.
Limited Repayment Options: Fewer flexible repayment plans and often no income-driven options.
Fewer Borrower Protections: Deferment and forbearance options are less common and more restrictive.
No Loan Forgiveness: Private loans are not eligible for federal forgiveness programs.
While private loans can be essential for some students, their less favorable terms mean they often contribute to higher overall debt burdens and more challenging repayment experiences.
Statistical Comparison of Borrowers
Data from 2025 suggests that borrowers with primarily federal loans are more likely to be enrolled in IDR plans and have access to a wider range of repayment strategies. Conversely, borrowers with significant private loan debt may face higher monthly payments and fewer options when encountering financial difficulties. The average interest rate for federal loans in 2025 for undergraduate direct subsidized/unsubsidized loans is around 6.53%, while private loan rates can range from 4% to 15% or higher, depending on creditworthiness.
A comparative breakdown might look like this:
Feature
Federal Loans (2025 Avg.)
Private Loans (2025 Avg.)
Total Debt Share
~92%
~8%
Interest Rates
~6.53% (Undergrad)
4% - 15%+
Repayment Flexibility
High (IDR, Deferment)
Low
Borrower Protections
High (PSLF, etc.)
Low
Eligibility
Financial Need, Enrollment
Creditworthiness
This comparison highlights why federal loans are generally preferred, and why understanding the composition of one's student loan portfolio is critical for effective debt management.
Student Loan Debt by Demographics: Who is Most Affected?
Student loan debt does not affect all individuals equally. Various demographic factors, including race, ethnicity, socioeconomic status, and gender, play a significant role in who borrows, how much they borrow, and their ability to repay. In 2025, these disparities persist, highlighting systemic inequalities in access to education and financial resources.
Racial and Ethnic Disparities
Research consistently shows that Black and Hispanic students borrow more, on average, than their White counterparts to finance their education. This often stems from:
Wealth Gap: Lower levels of intergenerational wealth mean that minority families have less ability to contribute to college costs, forcing students to borrow more.
Access to Resources: Disparities in K-12 education can lead to a greater need for remedial or preparatory courses, increasing time to degree and thus costs.
Lower Earning Potential: Even with degrees, Black and Hispanic graduates often face lower starting salaries and slower wage growth, making repayment more challenging.
As of 2025, studies indicate that Black borrowers, on average, hold a higher percentage of their income in student loan debt compared to White borrowers. This can lead to a longer repayment period and a greater likelihood of default. Similarly, Hispanic borrowers face similar challenges, often compounded by other socioeconomic factors.
Gender Differences in Debt
While women are more likely to enroll in and graduate from college, they often carry a higher average debt load than men. This can be attributed to several factors:
Field of Study: Women are more likely to pursue fields that may have lower earning potential, impacting repayment capacity.
Wage Gap: The persistent gender wage gap means women earn less than men for comparable work, making it harder to service debt.
Family Responsibilities: Women often bear a greater share of childcare and eldercare responsibilities, which can interrupt careers and reduce income.
By 2025, while the gap may be narrowing in some areas, women, particularly women of color, often face a more challenging path to student loan freedom.
Socioeconomic Status and Debt Burden
Students from low-income backgrounds are more likely to rely on student loans to finance their education. This often means they borrow more, and their ability to repay is hampered by lower starting salaries and fewer financial resources. They are also more vulnerable to economic downturns and less likely to have family support for loan payments. This creates a cycle where the cost of education can perpetuate economic inequality.
First-Generation College Students
First-generation college students, those whose parents did not complete a four-year degree, often face unique challenges. They may lack guidance on navigating the financial aid system, understanding loan terms, and making informed borrowing decisions. This can lead to higher borrowing amounts and a greater risk of financial distress. In 2025, while support systems are improving, this demographic remains particularly susceptible to the burdens of student loan debt.
The Far-Reaching Impact of Student Loan Debt
Student loan debt is more than just a financial obligation; it's a pervasive force that shapes individual lives, family decisions, and the broader economy. In 2025, the cumulative effect of trillions of dollars in debt continues to influence critical aspects of American life.
Delayed Life Milestones
One of the most significant impacts of student loan debt is the delay of major life milestones. Borrowers struggling with substantial monthly payments often postpone or forgo:
Homeownership: High debt-to-income ratios can make it difficult to qualify for mortgages, and the lack of savings for down payments is a major hurdle.
Marriage and Family Formation: Financial insecurity can lead individuals to delay getting married or starting a family, impacting birth rates and family structures.
Retirement Savings: Prioritizing loan repayment often means less money is available for long-term savings, potentially leading to financial insecurity in old age.
Entrepreneurship: The risk associated with starting a business is amplified when burdened by significant debt, discouraging innovation and job creation.
By 2025, data suggests that millennials and Gen Z are buying homes and starting families later than previous generations, with student loan debt cited as a primary reason.
Mental and Emotional Well-being
The constant pressure of student loan debt can take a toll on mental and emotional health. Many borrowers experience:
Stress and Anxiety: The fear of default, overwhelming interest accruals, and the seemingly endless repayment period can lead to chronic stress and anxiety.
Depression: Financial struggles are a known contributor to depression and other mental health issues.
Reduced Quality of Life: The inability to afford desired lifestyles, pursue hobbies, or save for personal goals can lead to feelings of dissatisfaction and hopelessness.
This psychological burden is a critical, though often overlooked, consequence of the student loan crisis.
Economic Consequences for the Nation
On a macroeconomic level, high levels of student loan debt can:
Hinder Consumer Spending: When a large portion of disposable income goes towards loan payments, consumer spending on goods and services decreases, impacting businesses and economic growth.
Slow Down the Housing Market: As mentioned, delayed homeownership reduces demand in the housing sector.
Impact Workforce Mobility: High debt can tie individuals to specific geographic locations or higher-paying jobs, even if they are not the best fit for their skills or aspirations.
Increase Default Rates: If borrowers are unable to manage their payments, default rates can rise, leading to negative credit impacts and potential economic instability.
In 2025, economists continue to debate the precise extent of student loan debt's impact on GDP and overall economic vitality, but the consensus is that it represents a significant drag.
Impact on Career Choices
The need to repay substantial loans can influence career decisions, sometimes pushing graduates towards higher-paying professions that may not align with their passions or societal needs. For instance, someone passionate about public service or education might opt for a more lucrative corporate job to manage their debt, leading to a shortage of talent in critical sectors.
Trends and Projections for 2025 and Beyond
The student loan debt landscape is dynamic, influenced by economic conditions, policy changes, and evolving educational costs. Understanding the current trends and projecting future scenarios is vital for students, policymakers, and financial institutions.
Rising Tuition Costs
Despite some efforts to control costs, tuition and fees at many institutions continue to rise, often outpacing inflation. This trend, which has been a primary driver of increased student loan debt, is projected to continue through 2025 and beyond. Factors contributing to this include state funding cuts for public universities, increased administrative costs, and demand for amenities. This persistent rise in educational expenses will likely necessitate continued borrowing for many students.
Policy Interventions and Their Effects
Government policies play a significant role in shaping student loan debt. In 2025, discussions and potential actions around student loan forgiveness, interest rate caps, and reforms to repayment plans are ongoing. The impact of these interventions can be substantial:
Loan Forgiveness Programs: While broad-based forgiveness remains a subject of debate, targeted programs like PSLF continue to offer relief to eligible borrowers.
Interest Rate Adjustments: Federal loan interest rates are set annually, and while they can fluctuate, they are generally more stable than private loan rates. Policy decisions can influence these rates.
Income-Driven Repayment (IDR) Reforms: Efforts to simplify and improve IDR plans are ongoing, aiming to make them more accessible and effective for borrowers.
The effectiveness and scope of these policies will significantly influence future debt levels and repayment outcomes.
Alternative Financing Models
As traditional student loan debt continues to be a concern, alternative financing models are emerging. These include:
Income Share Agreements (ISAs): Students receive funding in exchange for a percentage of their future income for a set period.
Scholarships and Grants: Increased emphasis on finding and securing non-repayable financial aid.
Employer-Sponsored Education: More companies are offering tuition assistance or reimbursement programs.
While these alternatives are not yet widespread enough to replace traditional loans, they represent a growing trend toward diversified approaches to funding higher education.
Projected Debt Levels
Given the ongoing trends of rising tuition and the continued reliance on borrowing, projections for 2025 and the immediate future suggest that total student loan debt will likely remain high, potentially even increasing. Average debt per borrower may also continue to climb, especially for those pursuing graduate and professional degrees. However, the impact of policy changes and the adoption of alternative financing could moderate these increases. The focus will likely remain on ensuring affordability and improving repayment outcomes.
Strategies for Managing Student Loan Debt
Navigating the complexities of student loan debt requires a proactive and informed approach. For borrowers in 2025, several strategies can help manage existing debt and make informed decisions about future borrowing.
Understand Your Loans
The first and most crucial step is to know exactly what you owe. This includes:
Loan Servicer: Identify who manages your loans (e.g., Nelnet, MOHELA, Aidvantage).
Loan Type: Determine if they are federal (Direct Subsidized, Direct Unsubsidized, PLUS) or private.
Interest Rates: Note the interest rate for each loan, as this impacts how much you'll pay over time.
Balances: Keep track of the principal amount owed on each loan.
Repayment Terms: Understand the standard repayment period and any specific conditions.
Utilize resources like the National Student Loan Data System (NSLDS) for federal loans to get a consolidated view.
Explore Repayment Options
Federal loans offer several repayment plans beyond the standard 10-year option:
Income-Driven Repayment (IDR) Plans: Such as SAVE, PAYE, IBR, and ICR, which cap monthly payments based on your income and family size. These can significantly lower your monthly burden and may lead to forgiveness after 20-25 years of qualifying payments.
Graduated Repayment: Payments start lower and increase over time.
Extended Repayment: Allows for longer repayment periods (up to 25 years), resulting in lower monthly payments but more interest paid overall.
For private loans, contact your lender to discuss any available hardship programs, though options are typically more limited.
Consider Refinancing and Consolidation
Federal Consolidation: Combines multiple federal loans into a single new loan with a weighted average interest rate. This simplifies payments but does not necessarily lower the interest rate.
Refinancing: Replacing existing federal or private loans with a new private loan, often with the goal of securing a lower interest rate or different repayment terms. Caution: Refinancing federal loans into private loans means losing federal benefits like IDR plans and forgiveness programs. This is generally only advisable for borrowers with stable, high incomes and excellent credit who are confident they can manage repayment without federal protections.
Research lenders carefully and compare offers before refinancing.
Seek Loan Forgiveness Programs
If you work in public service (government, non-profit), explore programs like Public Service Loan Forgiveness (PSLF). This program forgives the remaining balance on Direct Loans after 120 qualifying monthly payments made while working full-time for an eligible employer. Understanding the strict requirements and diligently tracking your progress is key to successful forgiveness.
Budgeting and Financial Planning
Creating a realistic budget is essential. Allocate funds for loan payments, essential living expenses, and savings. Prioritize high-interest debt if you have multiple loans. Consider setting up automatic payments to avoid missed deadlines and potentially receive a small interest rate reduction from some lenders.
Avoid Unnecessary Borrowing
For prospective students, careful planning is paramount. Explore all financial aid options, including scholarships and grants, before resorting to loans. Borrow only what is absolutely necessary for educational expenses. Consider the return on investment for your chosen degree and institution.
Conclusion: Navigating the Student Loan Landscape
The student loan debt statistics for 2025 paint a clear picture: the total outstanding debt remains a monumental figure, hovering around $1.77 trillion, with average debt loads varying significantly by degree and institution. While federal loans constitute the vast majority, understanding the nuances of both federal and private options is critical for borrowers. The impact of this debt extends far beyond individual finances, delaying life milestones, affecting mental well-being, and posing challenges to national economic growth.
Demographic disparities persist, with minority students and women often bearing a disproportionate burden. As we look ahead, rising tuition costs and policy decisions will continue to shape the student loan landscape. However, for individuals grappling with this debt, proactive management is key. Understanding your loans, exploring repayment options like IDR plans, considering refinancing judiciously, and seeking eligible forgiveness programs are vital steps.
Ultimately, navigating the student loan landscape in 2025 requires informed decision-making, diligent planning, and an awareness of available resources. By staying educated and strategic, borrowers can work towards a future where their educational investment empowers rather than burdens them.
null
Student Loan Debt Statistics 2025 Average and Total Debt